Global Equities Market hit by Surging Covid Cases in China
22 November 2022, 07:37

Stock markets have either retreated or are trading flat, thanks to the second-largest economy in the world experiencing a surge in covid-19 cases
What You Need To Know
The U.S. equities market dropped last night followed by Asian equities markets due to the worsening outbreak of Covid-19 in China. The first Covid-related death recorded in almost half a year has led to concerns that the Chinese Authorities may tighten its Covid-zero policy. Saudi’s minister stated that the OPEC+ members have no plan to increase oil production but suggest further cuts if necessary; the organization will have their meeting in December and a further announcement will be made after the meeting. The domino effect started to emerge after the collapse of FTX as more cryptocurrency brokers faced credit crunch issues. Genesis, one of the brokers, is seeking $1 billion to prevent them from going bankrupt.
| Look Out For |
Current rate hike bets on 14th December Fed interest rate decision:
75 bps (24.2%) VS 50 bps (75.8%)

Market Movements

DXY
The Greenback surged against most major currencies yesterday, recouping recent losses amid fresh Covid-19 restrictions in China that had sparked concerns over the global economic outlook, which stoked a shift in sentiment toward the safe-haven Dollar. In addition, the Greenback received additional support following the Federal Reserve’s hawkish tone. Federal Reserve Bank of San Francisco President Mary Daly claimed that the US central bank could increase its rate above 5% if inflation does not cool off.
The Dollar Index is trading higher while currently testing the resistance level. However, MACD has illustrated diminishing bullish momentum, while RSI is at 61, suggesting the index is going into overbought territory.
Resistance level: 107.80, 109.65
Support level: 106.15, 104.75

XAU/USD
Gold prices continue to edge lower, hovering around key support levels as the US dollar appreciation has continued to weigh on the US-denominated gold. Recent hawkish statements from Fed members had indicated that the central bank would likely continue its aggressive hikes path to stabilise the inflation rate, spurring further bullish momentum on the US Dollar.
The gold market is trading lower following prior retracement from the resistance level. However, MACD has illustrated diminishing bearish momentum, while RSI is at 38, suggesting the commodity is going into oversold territory.
Resistance level: 1770.35, 1809.25
Support level: 1727.20, 1681.85
EUR/USD
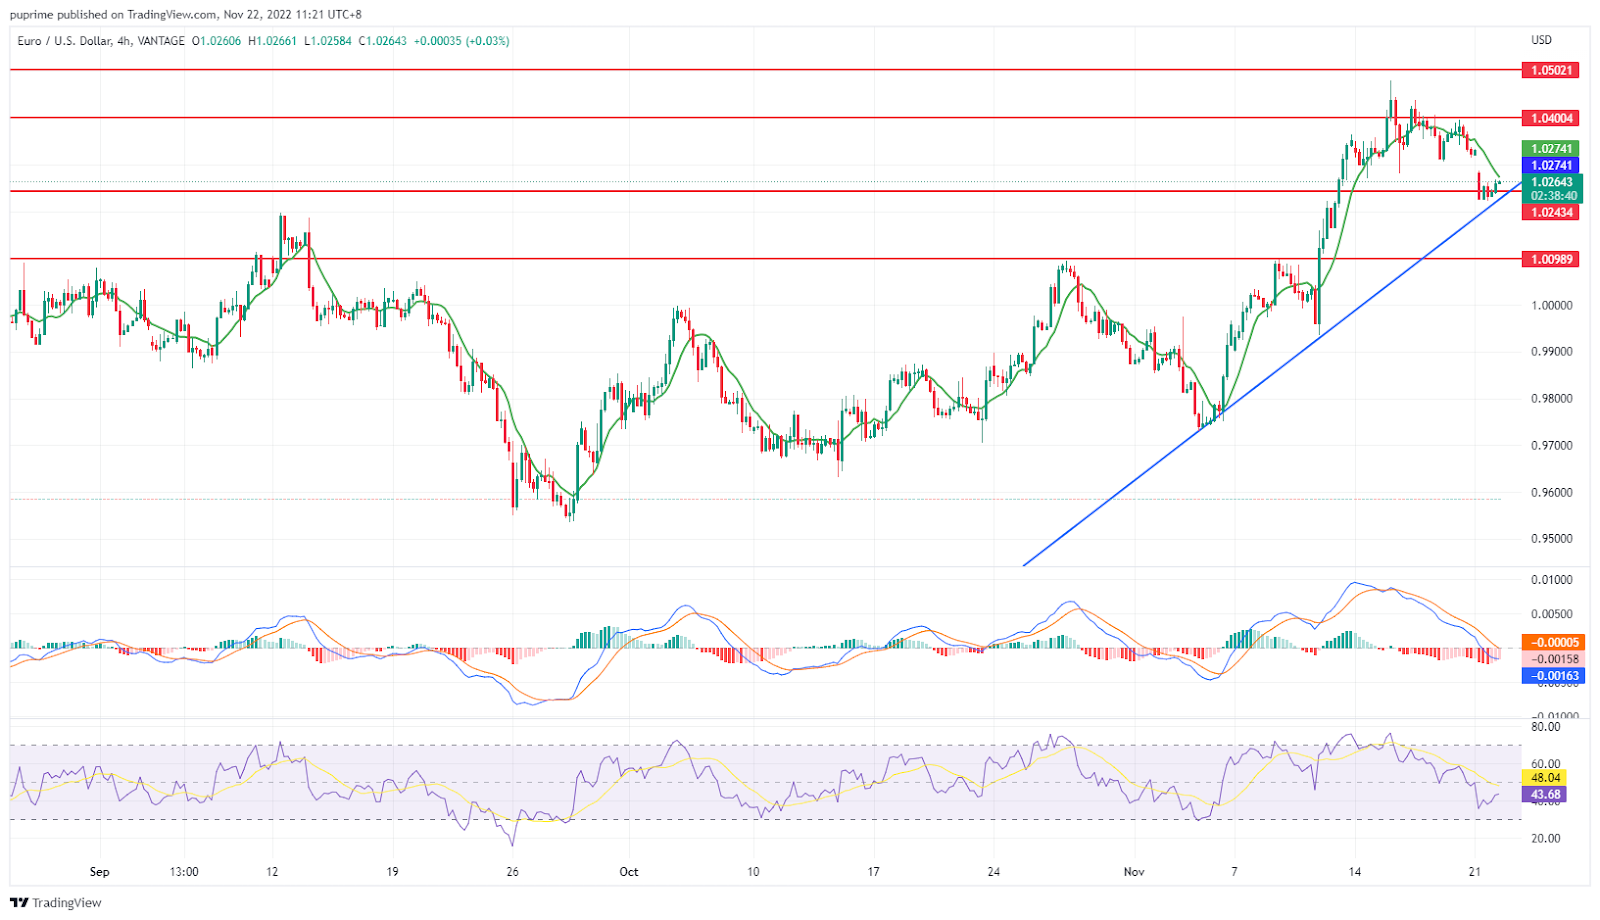
The euro has been suppressed by the strong resistance line at 1.0401 and has recorded a 3-days downtrend due to a stronger dollar. The geopolitical uncertainty in the euro region and the gloomy economic outlook from China has pushed the demand for the dollar higher. A more hawkish stance from the Fed after the U.S. retail sales report released in the past week will also strengthen the dollar.
The pair is supported at the level of 1.0245 and has been suppressed by the resistance level at 1.0401 in the past week. The MACD and RSI both show that the pair’s bullish momentum is halted where MACD has crossed below the zero line and RSI has gone to the oversold zone. The pair probably will trade between the range of 1.0245 to 1.0401 before any catalyst triggers the pair movement.
Resistance level: 1.0401,1.0502
Support level: 1.0245, 1.00989
BTC/USD
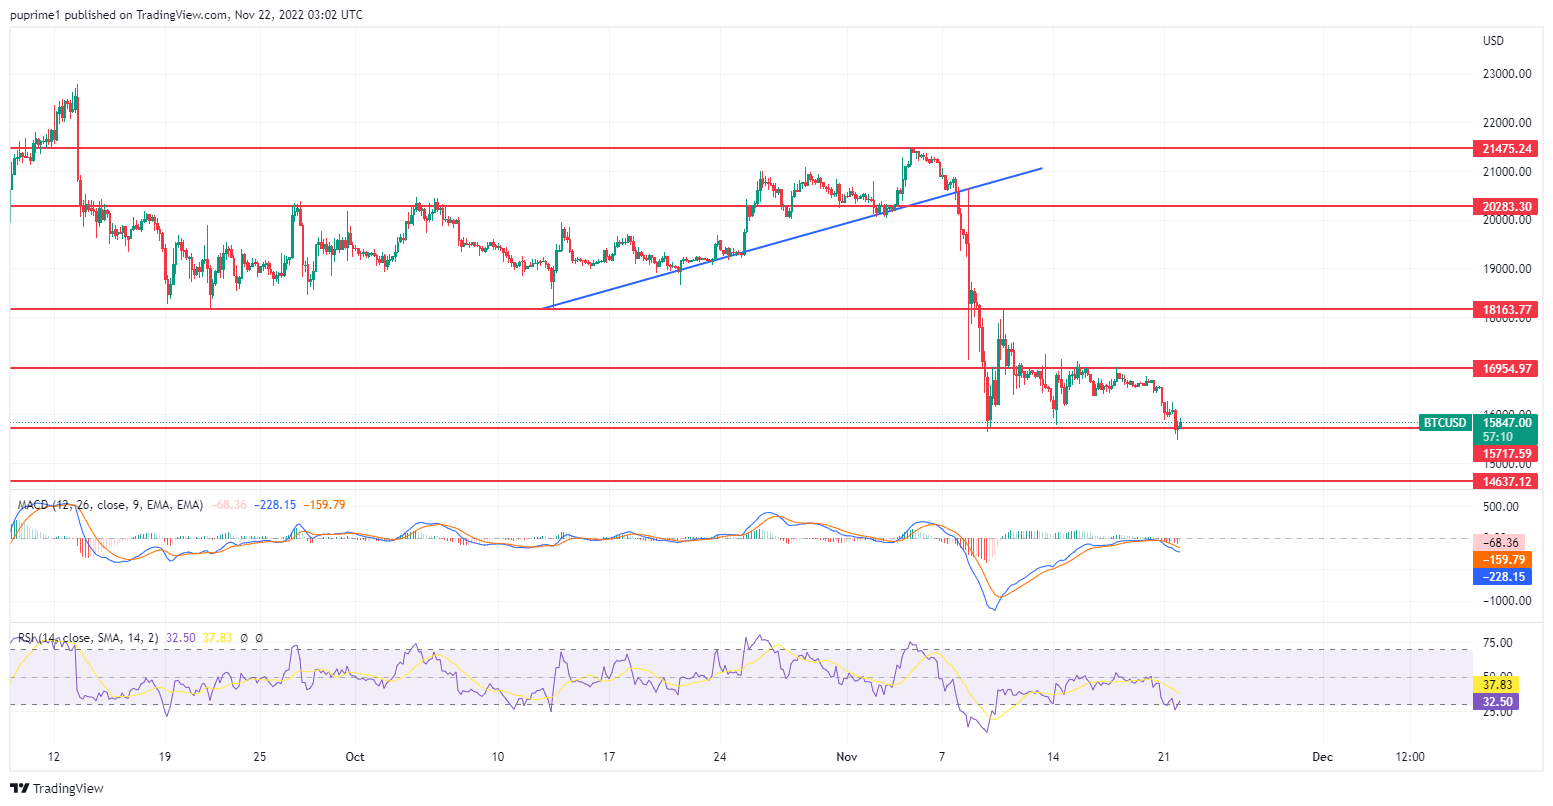
Bitcoin slumped to the lowest level in more than a week, dragging down the appeal of other major cryptocurrencies amid the spillover effects from the dramatic collapse of FTX continued to ripple through the market. Reports over the weekend indicated that FTX currently owes its 50 largest unsecured creditors up to $3.1 billion. The crypto market remains highly volatile as it is unclear how the FTX saga will end and whether there will be more contagion effects across the industry. Investors are advised to monitor further developments in the cryptocurrency market for further trading signals.
BTC is trading lower while currently testing the support level. Nevertheless, MACD has illustrated diminishing bearish momentum, while RSI is at 32, suggesting the product is going into oversold territory.
Resistance level: 16955, 18165
Support level: 15720, 14635
DJ30
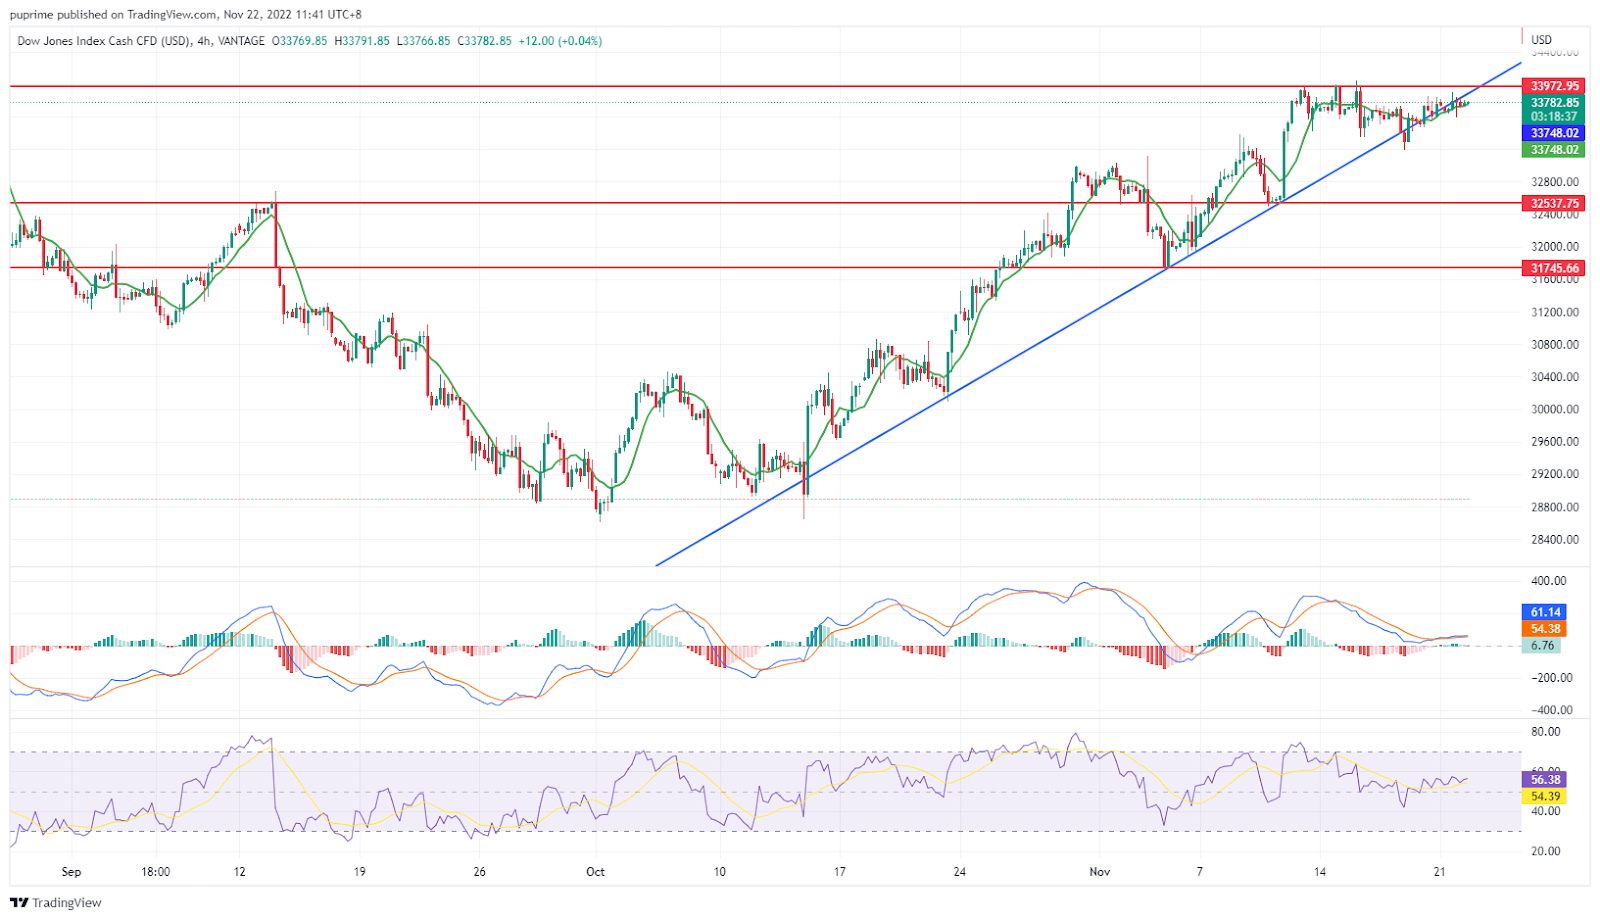
Dow Jones has enjoyed a nearly 18% surge in the past month but the momentum seems to be weakened. Probably due to the better-than-expected retail sales report released last week has urged the Fed to raise further rate with the possibility of 75 bps in the next month. A gloomy economic outlook from China and geopolitical issues in the Euro region also impact the U.S. equities market.
On the technical side, although the MACD has dropped from above, it is able to stay above the zero line while the MACD line stays above the signal line. The RSI has been hovering near the 50-level zone with a bullish bias.
Resistance level: 33972, 34784
Support level: 32537, 31745
GBP/USD
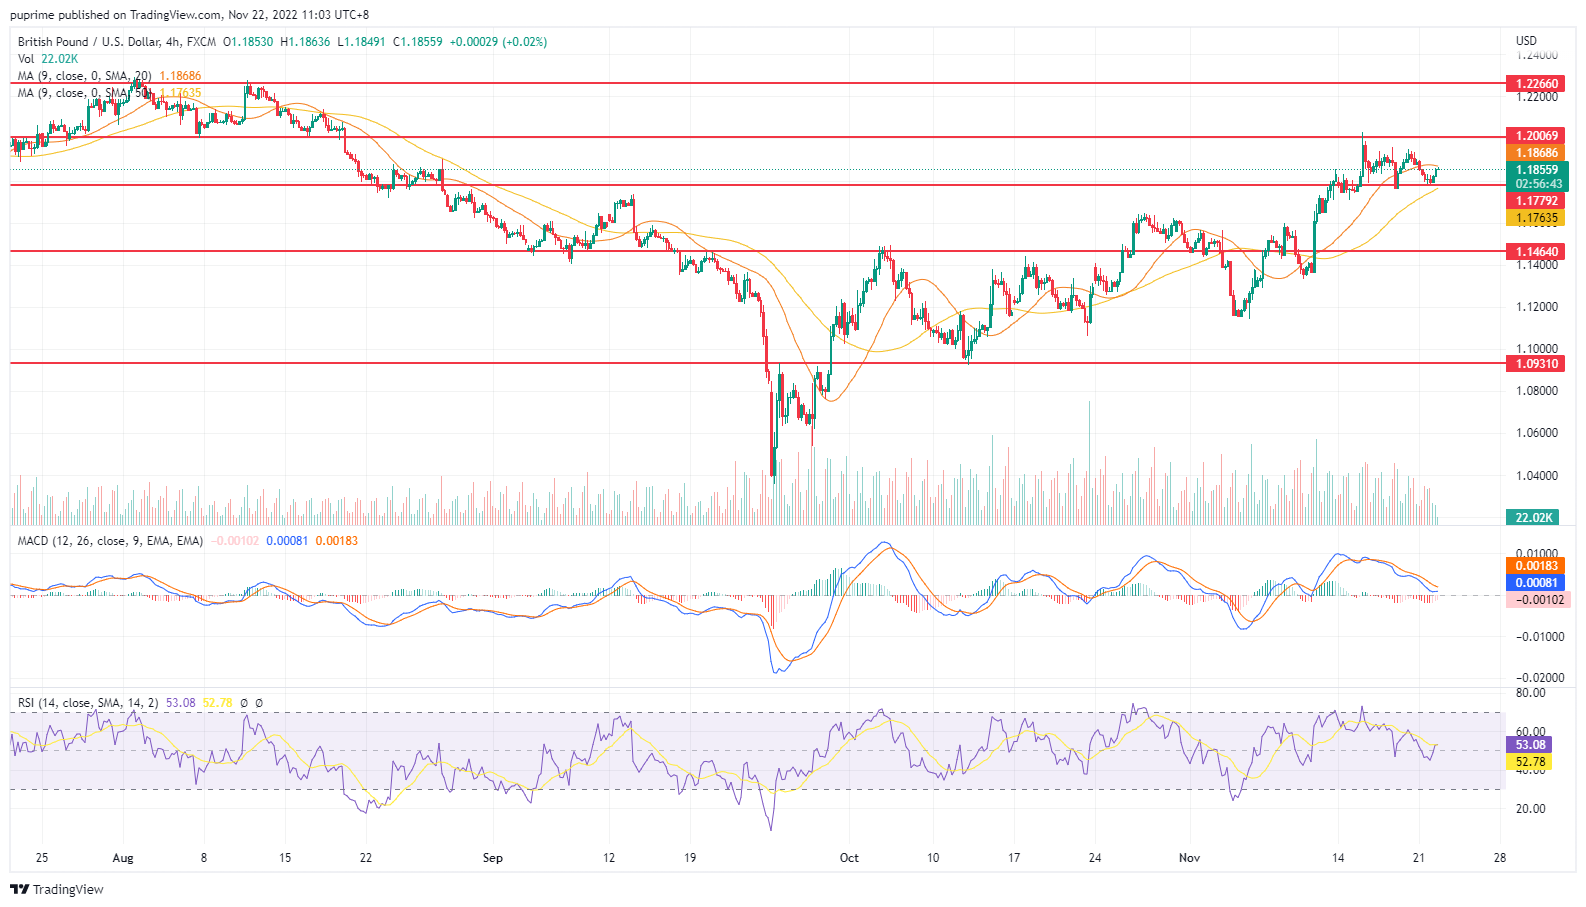
The pound dropped against the strengthened US dollar on Monday as global risk sentiment increased by worsening Covid-19 cases in China, the world’s second-largest economy. The pair was down by 0.6% to 1.1859 at the time of writing due to China battling numerous COVID flare-ups. The risk-sensitive pound is expected to weaken further this week, with public finance data due on Tuesday and PMI data on Wednesday.
The pound remains hovering between 1.1779 to 1.2000 after the announcement of tax rises and spending cuts last week. Investors could keep an eye on the economic data this week for further trading signals. Moreover, the MACD line is dropping near the zero line, which indicates a diminishing bullish momentum in the short term. At the same time, RSI is trading around 53, which suggests a bearish momentum ahead.
Resistance:1.200, 1.2266
Support: 1.1779, 1.1464

USD/JPY
The yen slumped more than 1% on Monday to 141.73 as of writing. Because investors turned in their money to the safe-haven U.S dollar as China renewed lockdown fears. Investors could keep an eye on the Japan inflation data, which will be announced later on Tuesday, for further trading signals. Governor Kuroda has insisted that inflation is temporary and should be up around 3%.
MACD has illustrated a diminishing bearish momentum for the pair as the line moves upward to stand above the zero line. At the same time, RSI is trading around 61, which indicates a bullish momentum ahead in the short term.
Resistance level: 146.04,152.00
Support level: 140.74,137.82
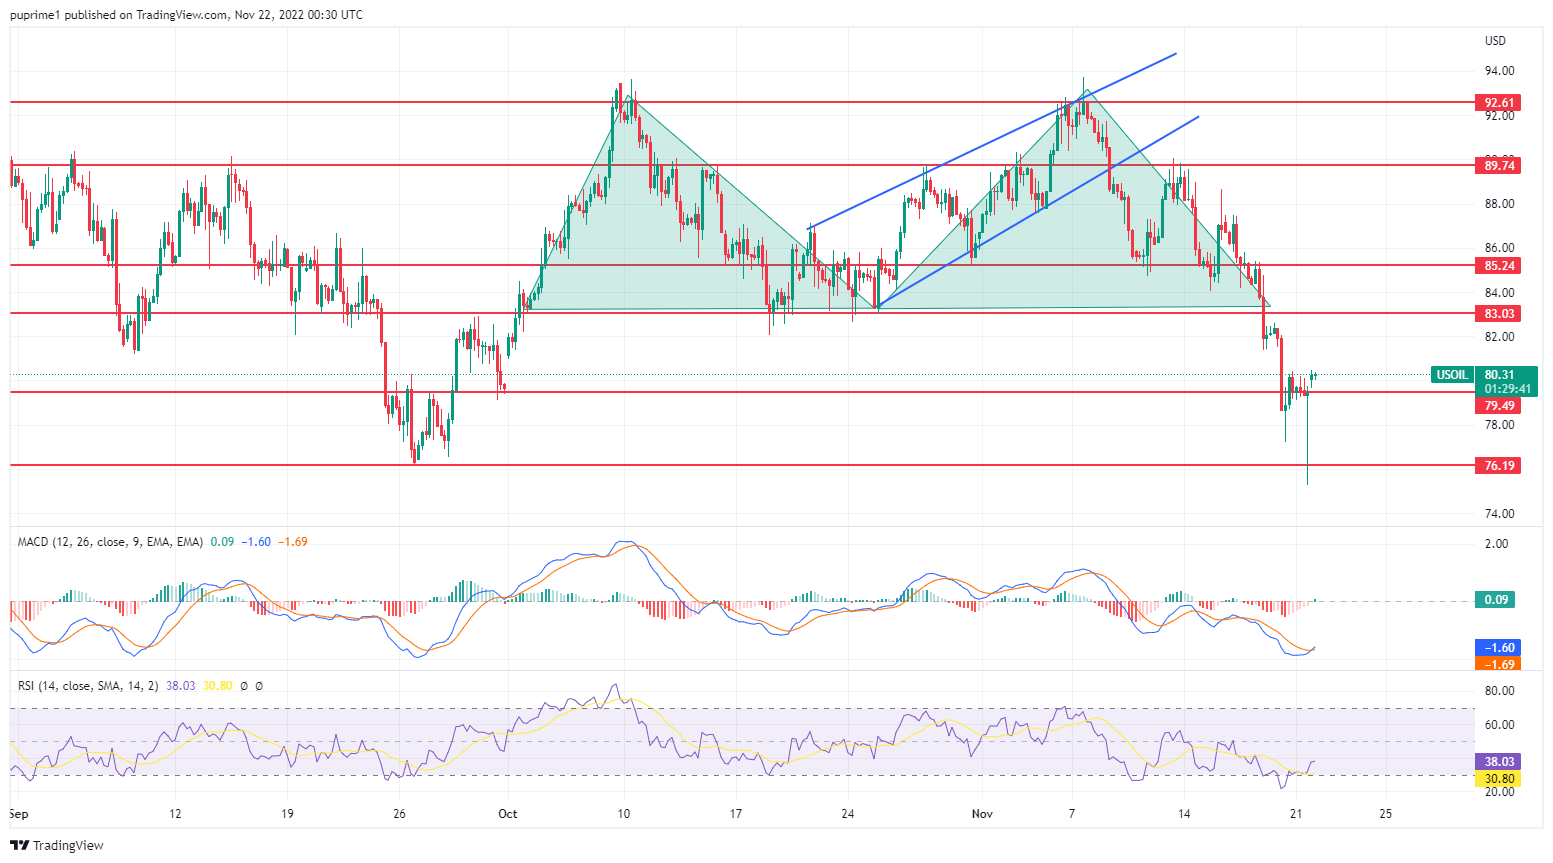
CL OIL
Oil prices recouped their losses after Saudi Energy Minister Abdulaziz bin Salman denied the news from the Wall Street Journal that OPEC is considering a 500,000 barrel-per-day oil production increase. Earlier, the Wall Street Journal reported that OPEC+ was discussing a potential oil production increment, prompting oil prices to go down by more than 4% daily. However, less than two hours later, Saudi officials denied the rumours. Investors will continue to scrutinise the OPEC+ meeting, due on 4th December 2022, to gauge the likely trends for oil prices in future.
Crude oil prices are trading lower while currently testing the support level. However, MACD has illustrated increasing bullish momentum, while RSI is at 38, indicating the commodity is going into oversold territory.
Resistance level: 83.05, 85.25
Support level: 79.50, 76.20